
Home prices on the Mississippi Gulf Coast rose again this summer, the 15th summer in a row by price per square foot. But the price on the deed tells only part of the story of the coastal housing market in the third quarter of 2026.
Sales fell, homes took longer to sell, and more sellers paid the buyer’s closing costs while holding their price. Keep reading for what that means, which measures moved most, and the figures to watch next quarter.
Summer home sales on the Mississippi Gulf Coast hit their lowest level since 2017, with homes taking 40.5 days to get a contract versus 32 a year before. The median price climbed 6.0% to $265,000, and supply sat at a balanced 4.8 months.
What This Summer Says About Gulf Coast Prices
The rise in Gulf Coast home prices is real, but smaller than the 6.0% jump in the median sale price suggests. Price per square foot, which accounts for home size, rose 4.3% on a year earlier. It moves less when a quarter sells more large or small homes, and both rises are normal for a Gulf Coast year.
To see what a $265,000 home runs each month once wind and flood insurance are counted, try our Gulf Coast house payment calculator.
Homes first listed at $300,000 to $499,999 sold for about the same share of their first asking price as a year earlier. But more of their sellers paid the buyer’s closing costs, so the price on the deed held while the total discount grew.
Homes first listed at $300,000 to $499,999 held their price, but sellers gave up more at closing
Sale price against first asking
97.2%
97.3% a year earlier
Sales with seller-paid closing costs
71.0%
64.7% a year earlier
Typical total given up
$15,229
price cut plus closing costs, $13,873 a year earlier
Homes sorted by original list price, comparing July through September 2026 with the same stretch of 2025. Based on information from MLS United, LLC for the period July 1, 2025 through September 30, 2026.
Buyers are answering with time rather than lower offers. Sales fell 9.0% on a year earlier, and the typical home took 40.5 days to reach a contract, up from 32. With 4.8 months of supply, the market stays close to balanced, so the slowdown shows up as waiting and concessions instead of falling prices.
Lacey says, “Buyers want proof. They’re pulling the comps and asking whether the price really matches what similar homes sold for.”
The Quarter’s Biggest Gulf Coast Market Movers
The slowest summer for Mississippi Gulf Coast home sales since 2017
Homes sold
1,446
fewest of any summer since 2017
Days to contract
40.5
longest of any summer since 2017
July to September of each year. Based on information from MLS United, LLC for the period January 1, 2006 through September 30, 2026.
Homes sold fell far more than the usual summer dip, and days to contract rose in a season when they usually fall. They were the fewest homes sold of any summer since 2017, and the longest time to sell of any summer since 2017. Smaller changes, from price cuts to the towns that moved most, are gathered further down.
Two long-running Gulf Coast trends carried on this summer. The median sale price was up on the year before for the 10th summer running. The share of homes selling at or above asking dropped for the 5th summer running.
Here is each measure against a year earlier, and whether the change was normal for the time of year.
Five figures from the third quarter of 2026
| Measure | Q3 2025 | Q3 2026 | Change on a year earlier | Against the usual |
|---|---|---|---|---|
| Median sale price | $250,000 | $265,000 | +6.0% | a normal move |
| Price per sq ft | $145.40 | $151.70 | +4.3% | a normal move |
| Homes sold | 1,589 | 1,446 | -9.0% | more than usual |
| Days to contract | 32 | 40.5 | +26.6% | more than usual |
| Months of supply | 4.8 | as of October 8, 2026, 4 to 6 is balanced |
Here, 'more than usual' means at least 1.5 times the typical change since 2010, with 2020 to 2023 left out. Based on information from MLS United, LLC for the period July 1, 2025 through September 30, 2026.
Fewest Homes Sold of Any Summer Since 2017
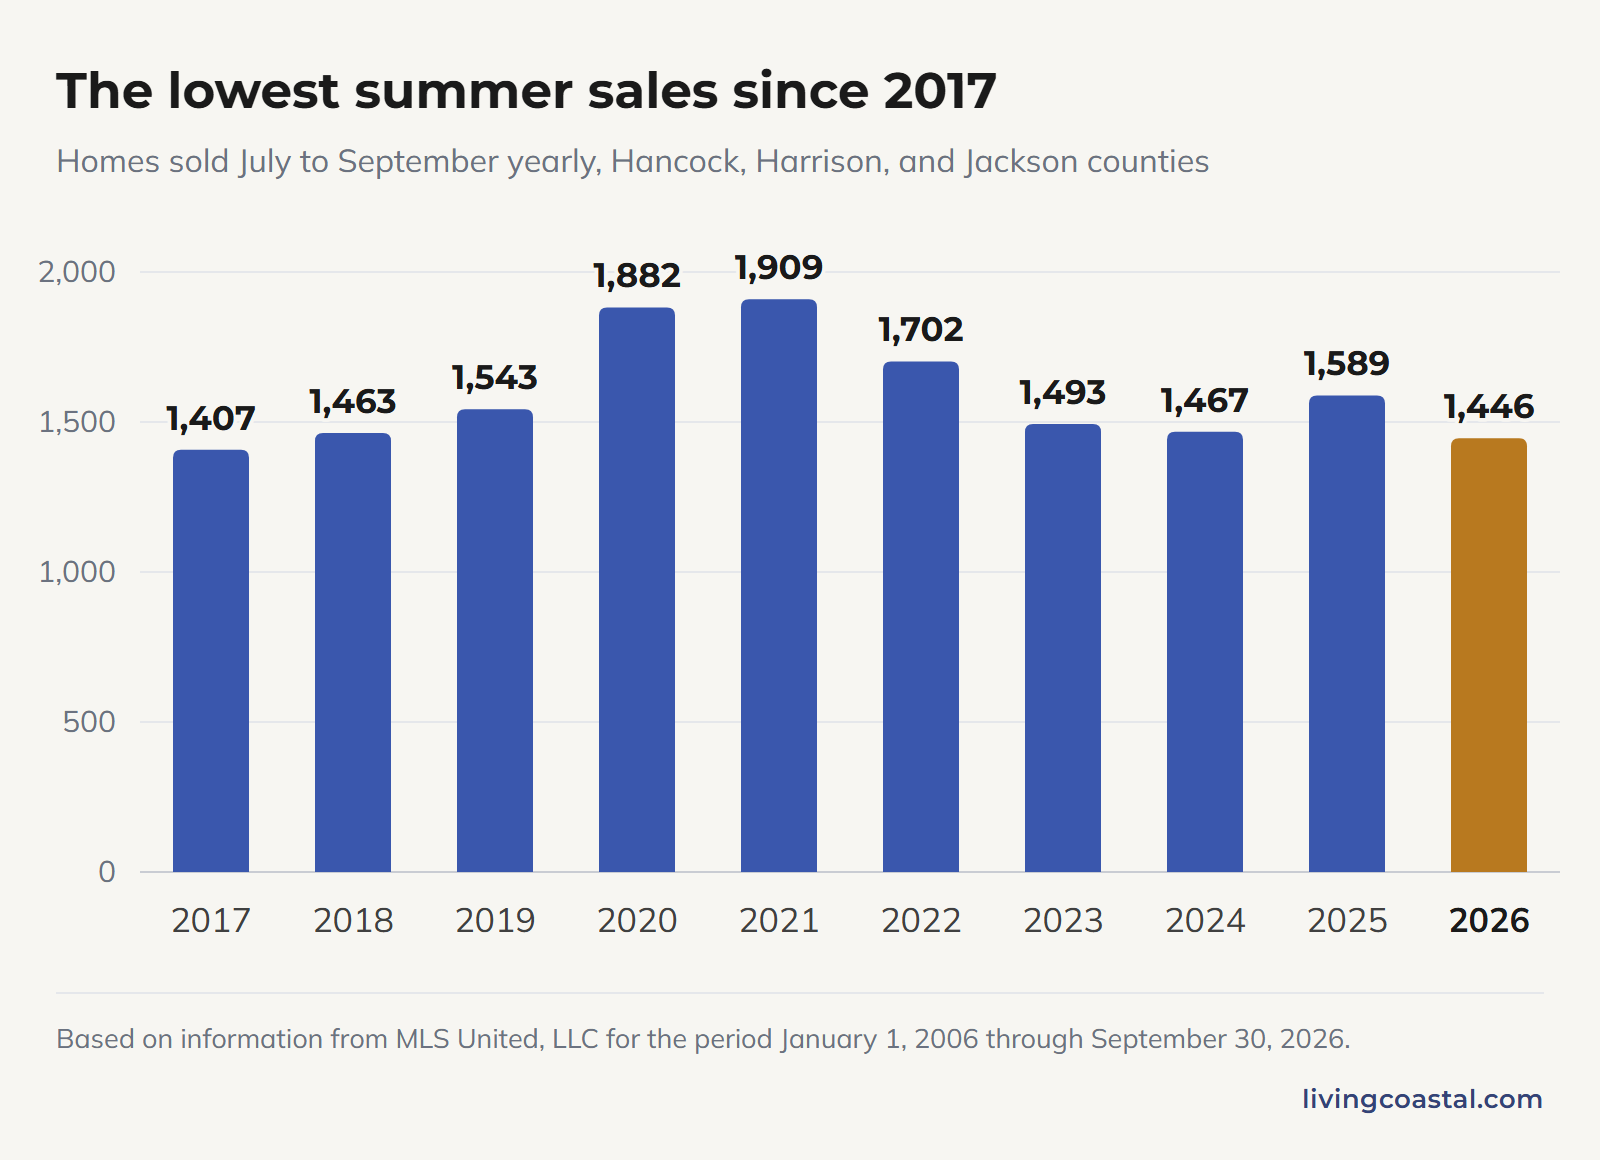
Mississippi Gulf Coast buyers closed on 1,446 homes from July through September, down 9.0% from 1,589 a year earlier. No summer has seen fewer since 2017, when 1,407 homes sold.
Sales usually dip about 1.1% from spring to summer. This year they fell 8.4% from spring, more than 7 times the usual dip. On a year earlier, summer sales typically change by about 4.7%.
The lowest summer sales since 2017
Homes sold July to September yearly, Hancock, Harrison, and Jackson counties

Show the numbers
| Summer | Homes sold |
|---|---|
| 2017 | 1,407 |
| 2018 | 1,463 |
| 2019 | 1,543 |
| 2020 | 1,882 |
| 2021 | 1,909 |
| 2022 | 1,702 |
| 2023 | 1,493 |
| 2024 | 1,467 |
| 2025 | 1,589 |
| 2026 | 1,446 |
Based on information from MLS United, LLC for the period January 1, 2006 through September 30, 2026.
With prices still up on a year earlier, buyers and sellers who could not agree on price often made no deal at all. Deals that did close still landed near asking, at 96.7% of the first price. So the gap between what sellers ask and what buyers will pay shows up as fewer sales, not lower prices.
- Buyers: With fewer closings, some neighborhoods have fewer recent sales to compare against. Ask for comparable sales from the past year, not just the past three months.
- Sellers: With fewer buyers closing, the most recent sales matter more for pricing than last year’s do.
Homes Took Longer to Sell Than Any Summer Since 2017
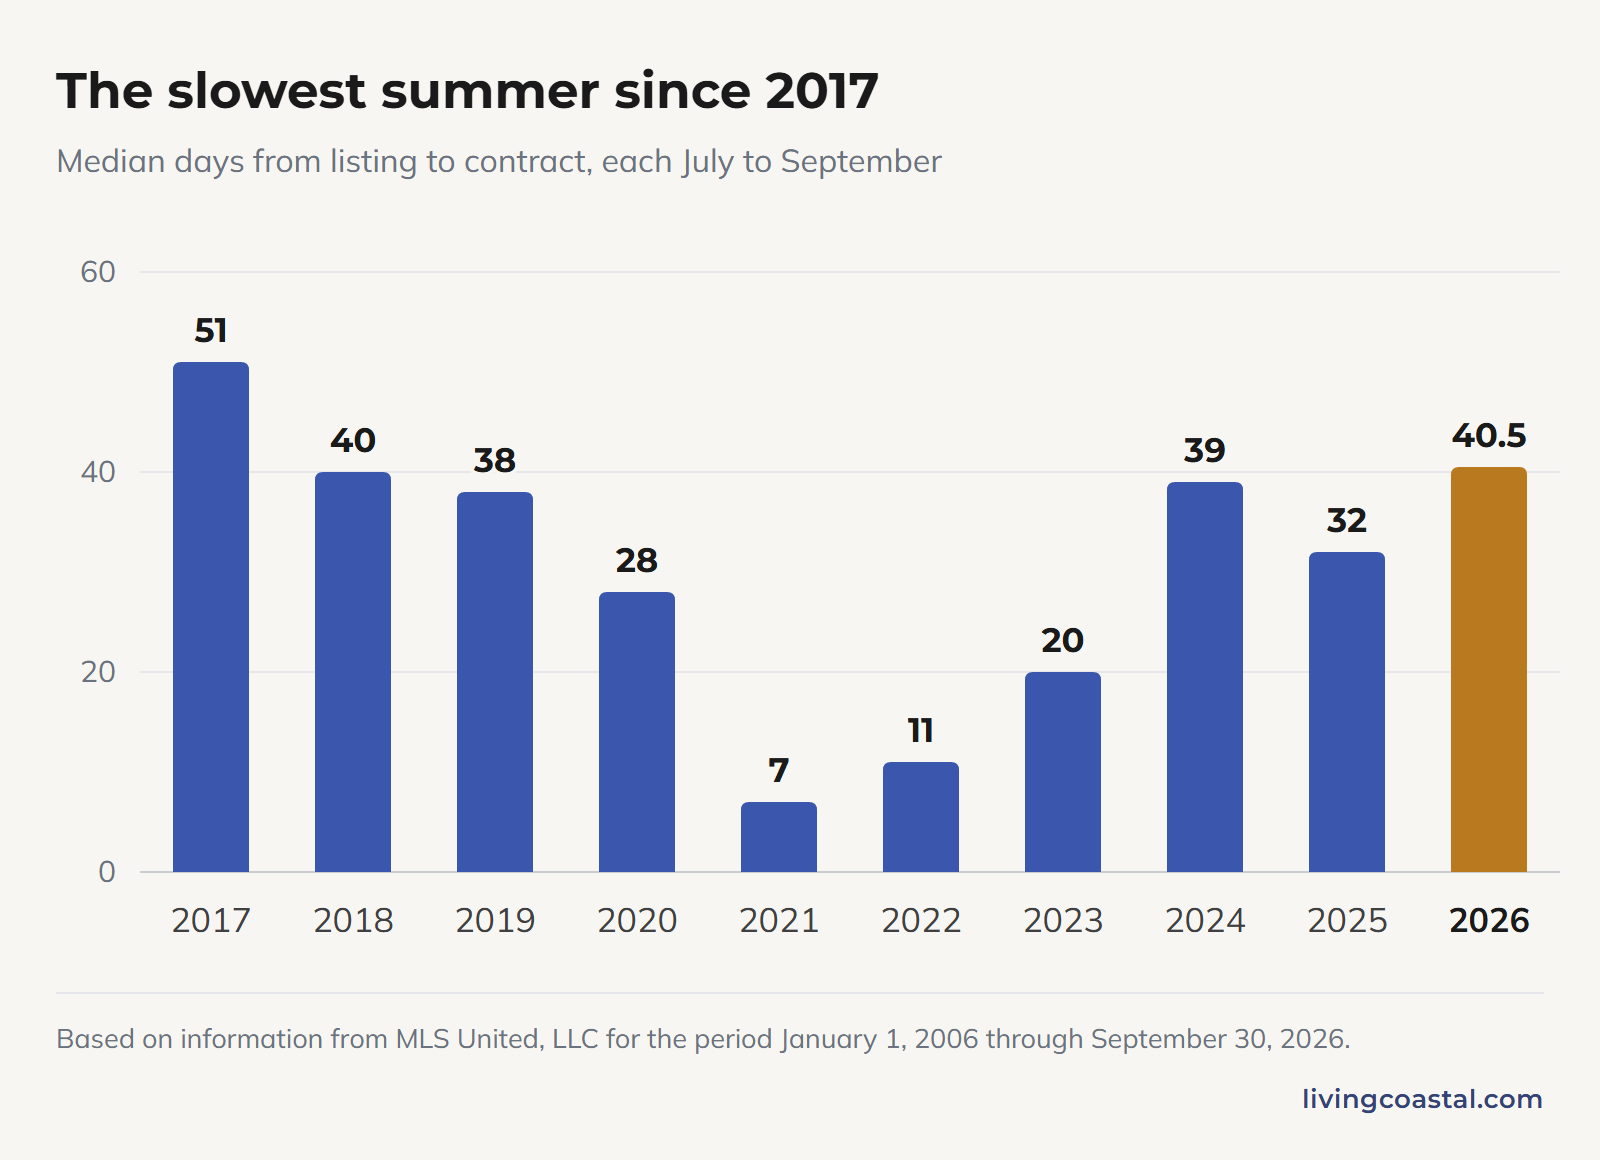
A typical Mississippi Gulf Coast home spent 40.5 days before going under contract from July through September, up from 32 a year earlier. No summer has been slower since 2017, when it took 51.
Summer is normally the quicker season. Selling time usually falls about 2.5% from spring to summer. This year it rose 9.5% from spring, going from 37 days to 40.5.
Lacey says, “My sellers felt it this summer. Even good homes are waiting longer for the right buyer.”
The slowest summer since 2017
Median days from listing to contract, each July to September

Show the numbers
| Summer | Median days to contract |
|---|---|
| 2017 | 51 |
| 2018 | 40 |
| 2019 | 38 |
| 2020 | 28 |
| 2021 | 7 |
| 2022 | 11 |
| 2023 | 20 |
| 2024 | 39 |
| 2025 | 32 |
| 2026 | 40.5 |
Based on information from MLS United, LLC for the period January 1, 2006 through September 30, 2026.
Slower sales and price cuts showed up together, and homes still sold for 96.7% of their first asking price. Of the listings on the market on both August 31 and October 8, 34.6% cut their price in between. Sellers still reach deals, but those deals take longer and often close below the first asking price.
- Buyers: Homes sit on the market longer, so you have more time to compare. A listing that has sat for weeks may have already cut its price once.
- Sellers: Plan on a longer wait than last year. A first price drawn from last spring’s sales is the one most likely to need a cut.
Other Gulf Coast Changes to Note This Quarter
Smaller changes in the Gulf Coast housing market this quarter, each with the full picture on the Mississippi Gulf Coast housing market page:
- Gulfport: days to contract rose 41.4% on a year earlier, going from 29 to 41, across 355 sales.
- Bay St. Louis: price per square foot rose 19.0% on a year earlier, going from $199.31 to $237.19, across 81 sales.
- Moss Point: homes sold fell 33.8% on a year earlier, going from 80 to 53.
- Waveland: homes sold rose 34.8% on a year earlier, moving from 23 to 31, a small sample of 23 sales.
- D’Iberville: homes sold fell 33.3% on a year earlier, moving from 39 to 26, a small sample of 26 sales.
What This Summer Adds Up to on the Gulf Coast
Taken together, sellers on the Mississippi Gulf Coast held their prices this summer and paid for it in time and closing costs. The gap between what sellers expect and what buyers will pay meant fewer sales and longer waits, not lower prices.
Lacey puts it plainly:
The sellers doing it right are pricing fairly from day one. The ones who test the market high end up sitting, and then they’re chasing it down. Don’t panic if the first few weeks are quiet. In the fall and winter, a month or two on the market is normal. If you’re buying, winter is when you’ll face the least competition. By March, you’ve usually got company.

In coastal MLS sales going back to 2006, fewer sales and slower selling arrived in the same summer five times before. After 2007 and 2008, the national housing downturn’s first years, price per square foot fell the next summer by 6.4% to 9.8%. After 2022, 2023, and 2024, it kept rising by 1.3% to 4.1%.
If price cuts keep spreading, the first place it would show is sale price against first asking, now 96.7%. If buyers come back in the fall, selling time is the figure that would turn first, now 40.5 days.
Figures to Watch in the Fourth Quarter
- Homes sold: 1,446 this summer, the lowest summer count since 2017. If sales pick up next summer, that would mean buyers are coming back. If they drop again, the slowdown would be deepening.
- Days to contract: 40.5 across the summer months. Longer waits would mean buyers are still holding back, and shorter ones would mean demand is returning.
- Price cuts: 34.6% of listings lowered their price between August 31 and October 8. A higher share would mean sellers are losing ground, and a lower one would mean buyers are coming back.
- Sale price versus first asking: 96.7% this summer, up 0.3 points on a year earlier, after four summers of declines. Another rise would mean sellers are getting closer to their price, and a drop would make this summer a pause.
- Homes selling at or above asking: 39.8% this summer, down for the 5th summer running but by just 0.4 points, the smallest move of that run. A turn would mean more homes are drawing full-price offers, and a bigger drop would mean fewer homes are drawing full-price offers.
- Months of supply: 4.8 now. Over 6 would put buyers in charge, and under 4 would favor sellers.
How the Busiest Gulf Coast Towns Compared
The 15 Gulf Coast towns with at least 10 sales in both summers, listed A to Z. A town marked with an asterisk had fewer than 30 sales in one of the two summers, so read its changes as a small sample. Sort the table by any column, or show one county.
Lucedale logged fewer than 10 sales in one of the two summers, which is too few to compare. So you will not find it in the table, but its sales still count in every coast-wide figure in this report.
The third quarter of 2026, town by town
| Bay St. Louis | Hancock | 83 | -20.2% | $390,000 | $237.19 | +19.0% | 58 |
|---|---|---|---|---|---|---|---|
| Biloxi | Harrison | 183 | -13.7% | $311,900 | $154.11 | +7.3% | 38 |
| D'Iberville* | Harrison | 26 | -33.3% | $233,000 | $140.87 | -6.5% | 22 |
| Diamondhead | Hancock | 60 | -25.0% | $255,000 | $140.54 | -4.3% | 55 |
| Gautier | Jackson | 78 | +9.9% | $224,500 | $129.95 | +4.8% | 21.5 |
| Gulfport | Harrison | 373 | -7.4% | $237,400 | $142.95 | +0.8% | 41 |
| Kiln* | Hancock | 20 | +25.0% | $295,000 | $176.28 | +30.8% | 32 |
| Long Beach | Harrison | 92 | +0.0% | $287,885 | $148.98 | +2.7% | 41 |
| Moss Point | Jackson | 53 | -33.8% | $172,500 | $97.24 | -14.9% | 32 |
| Ocean Springs | Jackson | 230 | -9.4% | $295,204 | $160.97 | +3.9% | 40 |
| Pascagoula | Jackson | 55 | +5.8% | $140,000 | $96.08 | -3.9% | 16 |
| Pass Christian | Harrison | 55 | -11.3% | $460,000 | $188.86 | -3.0% | 50 |
| Saucier | Harrison | 31 | -11.4% | $270,000 | $153.35 | +0.3% | 26 |
| Vancleave | Jackson | 51 | +2.0% | $330,000 | $167.81 | +10.2% | 27.5 |
| Waveland* | Hancock | 31 | +34.8% | $295,000 | $202.27 | +13.9% | 71 |
Changes are on the same quarter a year earlier, and an asterisk marks a small sample of fewer than 30 sales in one summer. Towns with fewer than 10 are left out. Based on information from MLS United, LLC for the period July 1, 2025 through September 30, 2026.
Your Mississippi Gulf Coast Housing Market Questions, Answered
Are house prices dropping in Mississippi?
No. Mississippi home values rose 3.7% in the year through the second quarter of 2026, ahead of the U.S. at 3.0%, by the FHFA House Price Index. On the Mississippi Gulf Coast, price per square foot rose 4.3% in the third quarter of 2026 on the year before.
Is now a good time to buy a house in Mississippi?
That depends on your plans, and nobody can time the market. What changed on the Mississippi Gulf Coast in the third quarter of 2026 is that buyers had more time. Homes took a median 40.5 days to go under contract, up from 32 a year earlier, and 34.6% of the homes on the market on both August 31 and October 8 cut their price in between.
What is the hardest month to sell a house?
On the Mississippi Gulf Coast, it is late in the year. From 2022 through October 5, 2026, homes listed in November took a median 50 days to go under contract, and December listings took 47. Homes listed in March moved fastest, in 18 days.
Wondering about a number, or about buying or selling here?
Lacey Perniciaro works with buyers and sellers across the Mississippi Gulf Coast. Ask her about any figure in this report, or what it means for a home you own or one you have your eye on.
Ask Lacey a question

Lacey Perniciaro, REALTOR®
Mississippi License S-56914
Call or text (228) 239-0958Office (228) 280-8026
Coastal Realty Group
How We Measured the Numbers for This Report
- Area. Hancock, Harrison and Jackson counties.
- Quarter. Homes that closed from July 1 to September 30, 2026, compared with July 1 to September 30, 2025. About 8% of closings from the final three days post late, under 1% of the quarter.
- Price cuts. Our own snapshots of every Mississippi Gulf Coast listing on August 31 and October 8, 2026.
- Data. Lacey Perniciaro, Coastal Realty Group, exported the MLS data. Next report: mid-January 2027.
- Definitions. For what each measure means, and when a measure earns its own section, see how we measure our market reports.
Based on information from MLS United, LLC for the period January 1, 2006 through September 30, 2026. How we handle data
Sources
- FHFA House Price Index (opens in a new tab) — All-transactions index, not seasonally adjusted, Gulfport-Biloxi metro, Mississippi and the U.S., through the second quarter of 2026.